Displaying debug data
Problem
You need an easy way to display debug data on-screen.
Solution
We’ll create an overlay that any node can register a property with, and that property will be displayed in an appropriate format.
Here’s an example of what we’re going for:
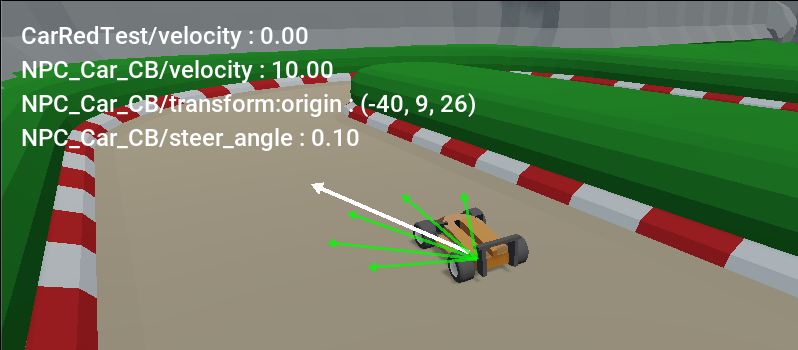
Start by adding a MarginContainer named DebugStats with a VBoxContainer child. Set the margins to a comfortable value (I usually use 20).
Let’s take a look at the code:
extends MarginContainer

class Property:
    var num_format = "%4.2f"
    var object  # The object being tracked.
    var property  # The property to display (NodePath).
    var label_ref  # A reference to the Label.
    var mode  # Display option (rounded, etc.)

    func _init(_object, _property, _label, _mode):
        object = _object
        property = _property
        label_ref = _label
        mode = _mode

    func update_label():
        # Sets the label's text.
        var s = object.name + "/" + property + " : "
        var p = object.get_indexed(property)
        match mode:
            "":
                s += str(p)
            "length":
                s += num_format % p.length()
            "round":
                match typeof(p):
                    TYPE_INT, TYPE_FLOAT:
                        s += num_format % p
                    TYPE_VECTOR2, TYPE_VECTOR3:
                        s += str(p.round())
        label_ref.text = s

var props = []  # An array of the tracked properties.

func _process(_delta):
    if not visible:
        return
    for prop in props:
        prop.update_label()
We begin with a custom class to encapsulate the data for the object and property we’re tracking. Let’s break down the class properties:
object- This is a reference to the object we’re tracking.property- This is in the form of aNodePath, meaning we can track something like"position", but also"position:x".label_ref- Each property is linked to aLabelnode, this is a reference to the label so that we can set itstext.mode- This is an optional setting to configure how the value should be displayed (see below).
In the update_label() method we build up a string to display in the label’s text property. We include the object’s name and which property we’re showing, plus the value modified by the mode option.
For this example, we’ve shown two settings for the mode option:
"length"- if thepropertyis a vector, we’ll display its length."round"- if the property is a numeric type, we’ll round its values.
We then need functions to add/remove properties from the display:
func add_property(object, property, mode):
    var label = load("res://debug_overlay/debug_label.tscn").instantiate()
    $VBoxContainer.add_child(label)
    properties.append(Property.new(object, property, label, mode))

func remove_property(object, property):
    for prop in properties:
        if prop.object == object and prop.property == property:
            prop.label.queue_free()
            properties.erase(prop)
add_property() can be called from any node (we should load the debug display as a singleton - see below).
Note we’re loading and instantiating a “debug_label” scene. This allows you to customize how you want the individual labels to appear - font, size, color, etc. Make a separate scene with a Label node and configure it to your liking.
Adding to game
To use it in game, you’ll want the debug display to be rendered on top of your game, whether in 2D or 3D. Create one more scene called “DebugOverlay” and make its root node a CanvasLayer. Add the DebugStats scene as a child.
For easy reference, I like to add this in a script on DebugOverlay:
@onready var stats = $DebugStats
Now add DebugOverlay in Project Settings > Autoload.
Now any node in the game can register/remove properties from the display like so:
DebugOverlay.stats.add_property(self, "velocity", "length")
DebugOverlay.stats.add_property(self, "transform:origin", "round")
You can see the debug overlay in action in many of the example projects on this site. See the related recipes for adding a debug drawing layer as well.